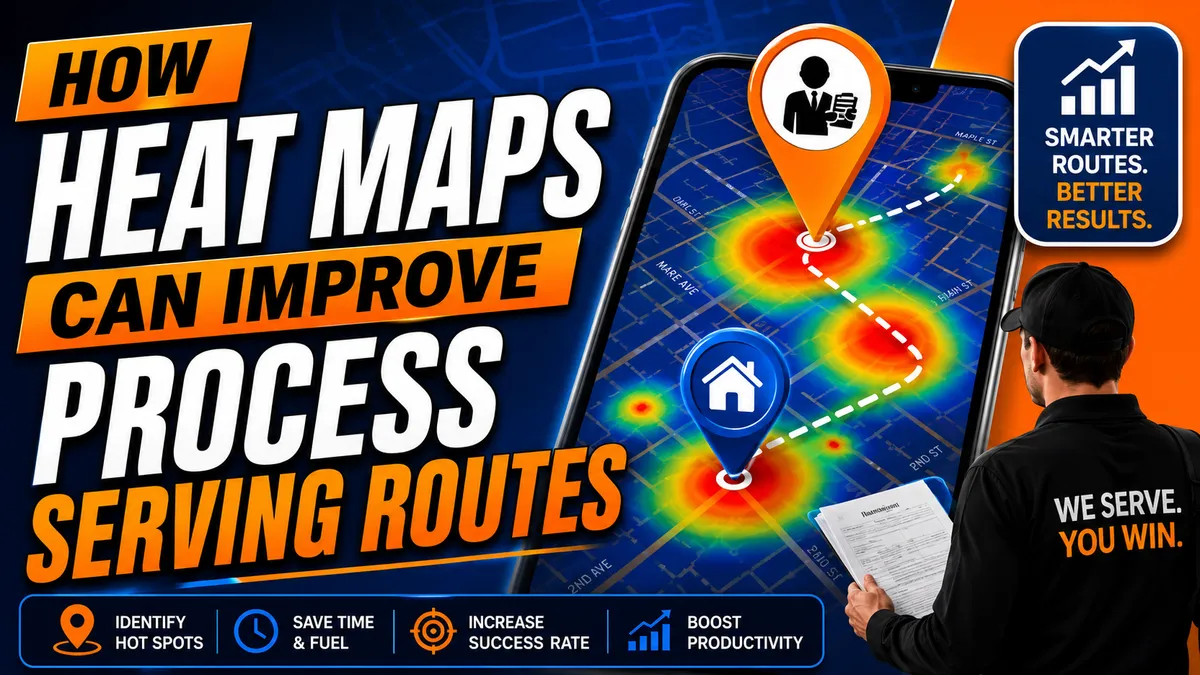
How Heat Maps Can Improve Process Serving Routes
Time is one of the most valuable assets in the process serving industry. Every extra mile driven, unnecessary stop, or inefficient route increases operating costs and reduces the number of service attempts that can be completed each day. As legal support professionals continue to adopt new technologies, one tool is emerging as a valuable resource for improving daily operations: heat maps.
Heat maps provide a visual representation of service activity, allowing process servers to quickly identify areas with high concentrations of assignments, recognize service patterns, and make smarter routing decisions. Instead of relying solely on GPS navigation or manually planning routes, agencies can use data to improve scheduling, reduce travel time, and maximize productivity.
Combined with modern route optimization technology, heat maps are helping process servers complete more assignments, reduce expenses, and deliver faster service for clients.
Introduction to Heat Maps in Process Serving
In the realm of process serving, ensuring the timely and efficient delivery of legal documents is essential. While heat maps have traditionally been used in industries such as marketing, logistics, and urban planning, they are becoming increasingly valuable in the legal support industry.
Heat maps help process servers visualize geographic patterns by displaying areas of activity using color gradients. Rather than reviewing long lists of addresses or spreadsheets, process servers can immediately identify neighborhoods with the highest concentration of service attempts, successful serves, repeat visits, or difficult locations.
As technology in process serving continues to evolve, heat maps are becoming an important planning tool that supports better dispatching, improved resource allocation, and more informed business decisions.
What Are Heat Maps and How Do They Work?
A heat map is a graphical representation of data where colors indicate the concentration or intensity of activity within a specific geographic area.
For heat maps for process servers, the map may display information such as:
Completed serves
Pending assignments
Failed service attempts
Skip trace locations
High-volume client territories
Rush service requests
Frequently visited neighborhoods
Typically:
Red represents the highest concentration of activity.
Orange indicates moderate activity.
Yellow represents lower activity.
Blue or green indicates minimal activity.
Instead of viewing dozens or hundreds of individual addresses, process servers can quickly understand where work is concentrated and plan accordingly.
Benefits of Heat Maps in Process Serving
The benefits of heat maps in process serving extend far beyond simple mapping. They provide valuable operational insights that help agencies become more efficient and profitable.
Improved Process Serving Efficiency
Heat maps make it easier to identify clusters of assignments, allowing process servers to complete multiple serves during a single trip rather than traveling across a city several times.
Benefits include:
Reduced travel time
Lower fuel costs
More completed serves per day
Better scheduling
Increased profitability
This is one of the simplest ways to optimize process serving routes while improving overall productivity.
Better Resource Allocation
For agencies managing multiple servers, heat maps simplify dispatching.
Managers can:
Assign the closest available process server
Balance workloads
Reduce overlapping routes
Improve response times
Increase territory coverage
Using process server mapping tools helps agencies deploy resources more strategically instead of relying on manual scheduling.
Data Driven Business Decisions
Heat maps reveal trends that may otherwise go unnoticed.
Examples include:
Areas generating the most assignments
Neighborhoods with frequent repeat attempts
High-demand service territories
Seasonal fluctuations
Growth opportunities in surrounding counties
These insights help agencies make smarter staffing, marketing, and expansion decisions.
How Heat Maps Improve Process Serving Routes
One of the biggest advantages of heat maps is their ability to support better process serving route optimization.
By combining location data, service history, and travel information, process servers can identify the most efficient routes for completing assignments.
Heat maps allow agencies to analyze:
Service locations
Attempt history
Time of day
Success rates
Traffic patterns
Geographic clusters
Instead of simply driving from one address to another, process servers can build optimized routes based on real operational data.
Group Nearby Assignments
Rather than traveling across multiple cities throughout the day, process servers can organize assignments by geographic zones.
For example:
Morning
Business districts
Commercial offices
Government buildings
Afternoon
Residential neighborhoods
Apartment complexes
Gated communities
Evening
Residential areas where occupants are more likely to be home
Grouping nearby assignments significantly improves route planning for process servers.
Reduce Fuel Costs
Fuel is one of the largest operating expenses for any mobile business.
By minimizing unnecessary travel, agencies can:
Reduce mileage
Lower fuel consumption
Decrease vehicle maintenance
Spend less time in traffic
Over hundreds or thousands of assignments, these savings can substantially improve profitability.
Increase Daily Serve Capacity
Time saved on driving creates more opportunities for service.
Optimized routes allow process servers to:
Accept additional assignments
Handle rush services
Increase first-attempt success rates
Complete more serves each day
Even one additional successful serve per day can produce significant annual revenue growth.
How to Implement Heat Maps in Route Planning
Implementing heat map tools for process servers involves several practical steps.
Step 1: Collect Accurate Data
Gather information including:
Service addresses
Attempt history
Successful serves
Failed attempts
Time of service
GPS locations
Accurate data produces better insights.
Step 2: Create the Heat Map
Import the data into mapping software capable of generating geographic visualizations.
Many digital tools for process servers can integrate location information automatically.
Step 3: Analyze Patterns
Review the heat map to identify:
High-volume neighborhoods
Low-success areas
Frequently visited locations
Geographic clusters
Traffic patterns
These insights become the foundation for better routing decisions.
Step 4: Adjust Routes
Use the data to redesign daily routes.
Process servers can:
Group nearby assignments
Schedule attempts based on historical success
Assign servers to familiar territories
Reduce unnecessary travel
This continuous improvement cycle leads to greater process serving efficiency over time.
Real World Examples
Many process serving companies have already seen measurable improvements after incorporating heat maps into their daily operations.
For example, an agency may discover that most successful residential serves occur during evening hours while commercial serves have the highest success rate during standard business hours.
By adjusting schedules based on these trends, agencies can increase first-attempt success rates while reducing repeat visits.
Similarly, agencies serving multiple counties can identify high-demand areas where hiring an additional local contractor could significantly reduce travel time and improve turnaround.
While results vary between organizations, businesses that make data-driven routing decisions often experience lower operating costs, improved productivity, and better client satisfaction.
Heat Map Tools for Process Servers
There are several technologies available for creating and analyzing heat maps.
Popular options include:
Google Maps Platform
Provides mapping capabilities that can be integrated into custom dispatching systems and applications.
Tableau
Offers advanced data visualization, interactive dashboards, and geographic analysis for business reporting.
ArcGIS
An enterprise-grade geographic information system that provides sophisticated mapping and spatial analysis tools for organizations managing large service territories.
As process server technology continues to advance, more business management platforms are expected to integrate built-in heat mapping features.
Challenges to Consider
Although heat maps offer substantial benefits, successful implementation requires careful planning.
Data Quality
Heat maps are only as reliable as the information used to create them.
Incomplete or inaccurate service records can produce misleading results.
Privacy and Security
Because process servers handle sensitive legal information, agencies should ensure mapping systems comply with applicable privacy requirements and internal security policies.
Training
Some advanced mapping platforms require technical knowledge to maximize their capabilities.
Fortunately, many newer systems offer user-friendly interfaces designed for everyday business users.
Combining Heat Maps with Modern Process Server Technology
Heat maps become even more valuable when integrated with other process server technology, including:
GPS verified service attempts
Mobile field applications
Real-time dispatching
Client portals
Automated notifications
Affidavit generation
Skip tracing platforms
Case management software
Together, these tools create a more connected and efficient workflow from assignment to completed affidavit.
The Future of Technology in Process Serving
The future of technology in process serving will continue moving toward greater automation and intelligent decision-making.
Emerging innovations include:
AI-powered route recommendations
Predictive service success analysis
Traffic-aware scheduling
Automated territory balancing
Real-time route adjustments
Smart dispatch based on workload and proximity
These advancements will further improve process serving strategies, helping agencies complete more assignments while reducing operating costs.
How MightyProcessServer.com Helps
Modern process serving requires more than delivering legal documents. It requires technology that helps agencies operate efficiently, communicate with clients, and scale their businesses.
MightyProcessServer.com provides powerful tools designed to support today's legal professionals, including:
Online order management
GPS verified service tracking
Real-time job updates
Mobile-friendly dashboard
Automated client notifications
Affidavit generation
Nationwide process server directory
Business management automation
These solutions help process servers streamline operations, improve client communication, and build more efficient workflows from order intake through completed service.
Conclusion
Heat maps are becoming an increasingly valuable resource for modern process servers. By visualizing service activity, identifying geographic trends, and supporting smarter process serving route optimization, they enable agencies to reduce travel time, lower costs, and complete more assignments.
When combined with GPS tracking, case management software, and other digital tools for process servers, heat maps provide actionable insights that improve daily operations and long-term business planning.
As route optimization technology continues to evolve, agencies that embrace data-driven decision-making will be better positioned to increase productivity, improve client satisfaction, and stay competitive in a rapidly changing legal support industry.
Whether you are an independent process server or managing a nationwide agency, adopting heat maps and other modern process serving strategies can help you deliver faster, smarter, and more reliable service.
Stay sharp. Stay informed. Live Mighty!
Read the full article at www.mightyprocessserver.com
This article is published by Process Server Daily, powered by MightyAutomation.ai, the leader in legal support intelligence.